Oscilloscope
In this tutorial, you wil learn how to visualize EEG data real-time and how to manipulate displaying channels. Note data shown in this tutorial are noise for illustration purpose, no real EEG data were collecting.
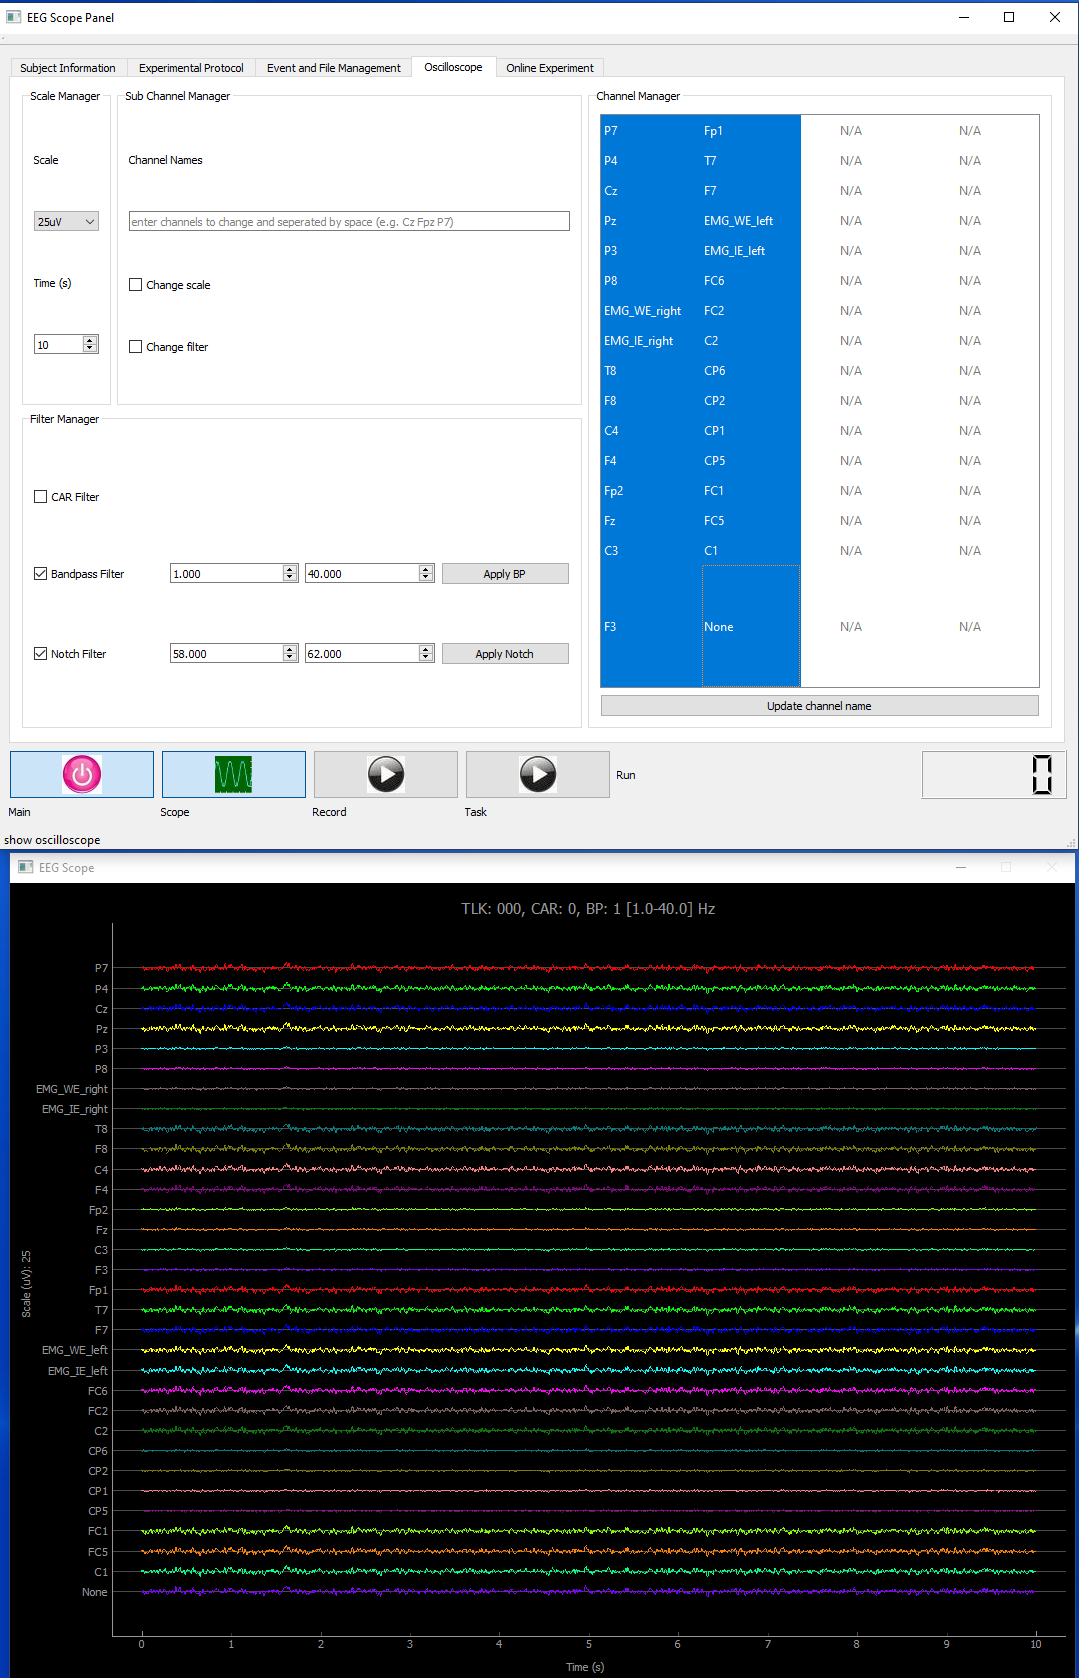
Open Scope by clicking Scope button in the bottom and select channels to look at. Channels are pushed from LSL, normally you will setup your channel names in the LSL interface as shown in first tutorial. However, some channels maybe used for different purpose like EMG or ECG. In this case, we could self define our unique channel names in StreamReceiver.py, which will be shown in tutorials for developers. Alternatively, direct renaming in GUI is also possible which will be shown in the following section.
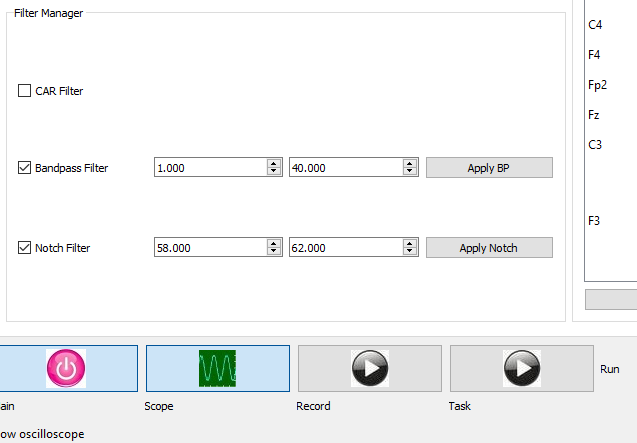
Filter signals by entering cut-off frequencies in filter manager. Normally data will only show up with proper interval after band pass filtering.
Feel free to change scale and time span of data by entering new values in scale manager.
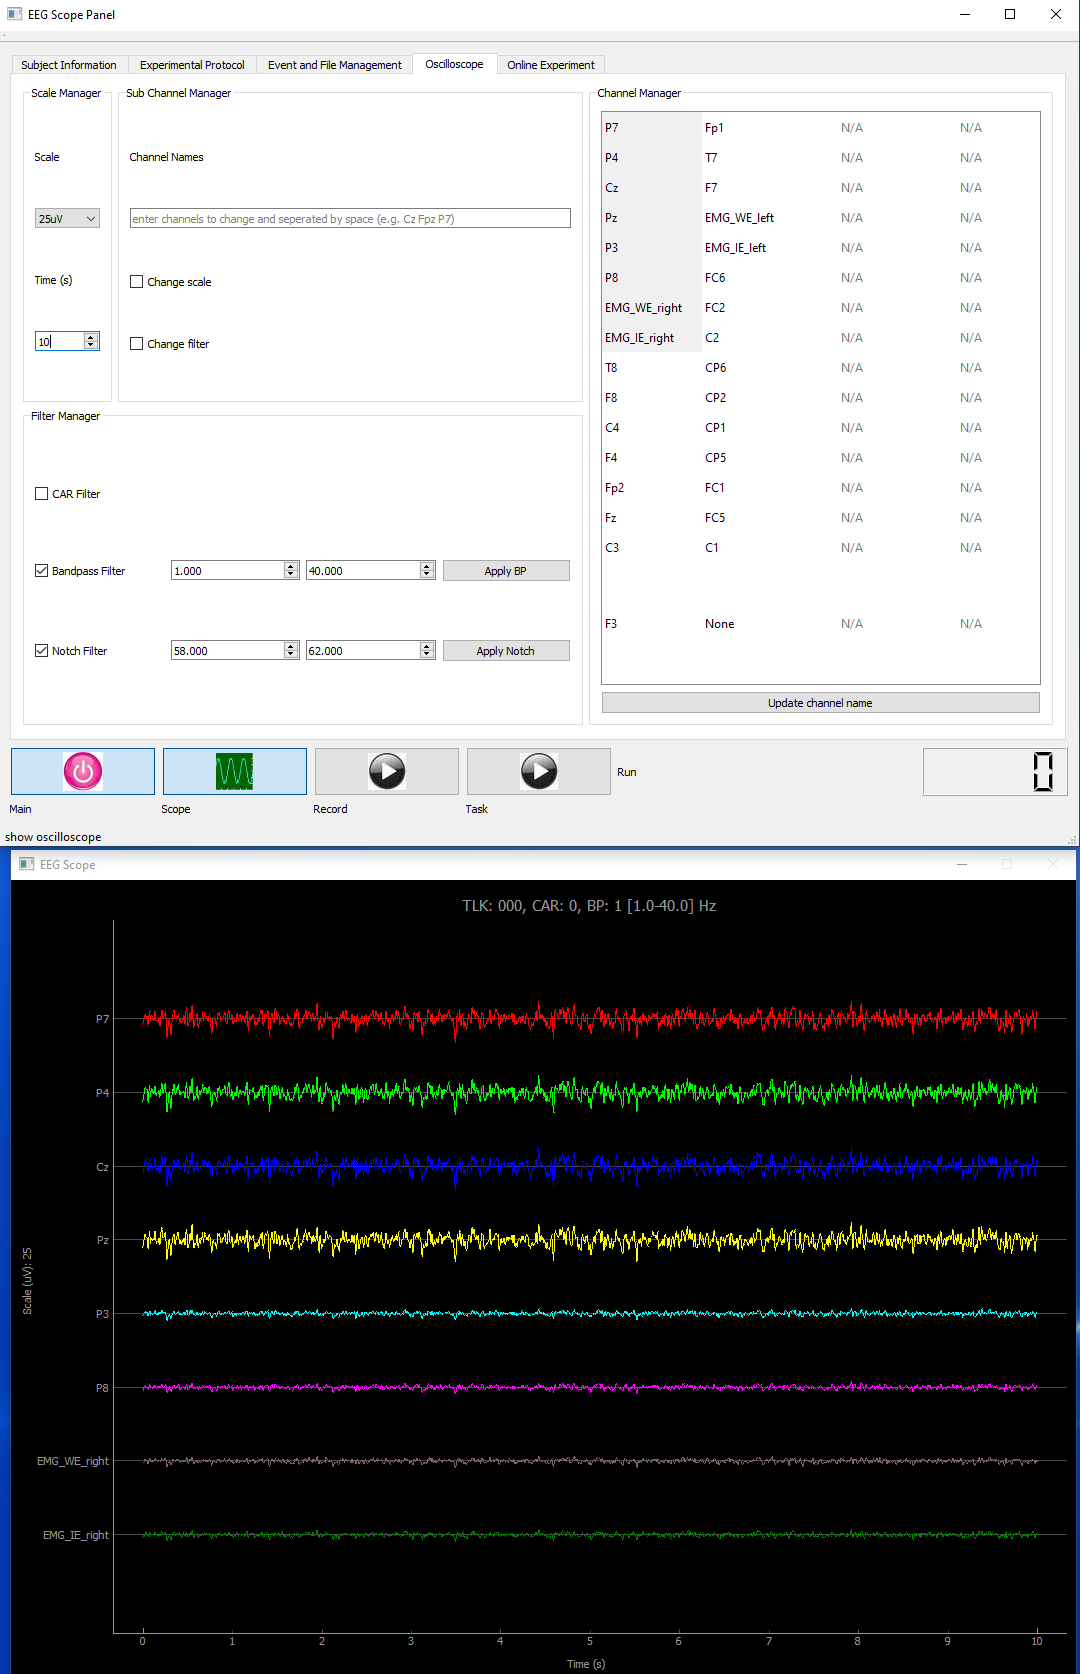
Select channels by highlighting them with mouse.
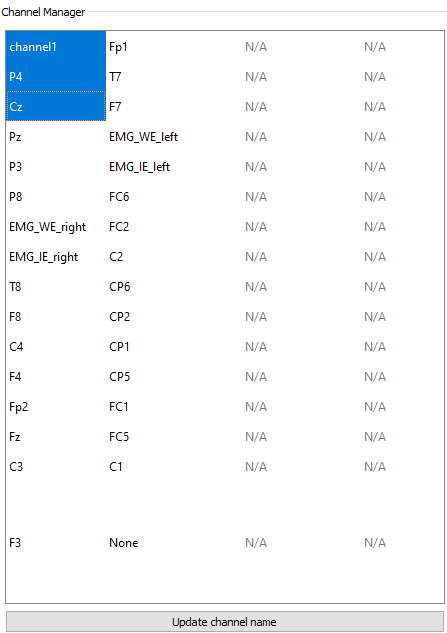
Modify first channel P7 by double clicking and entering new name as ‘channel1’. Then click update channel name button.As you can see, the channel name in oscilloscpe will update.
- Change sub channel filter and scales.
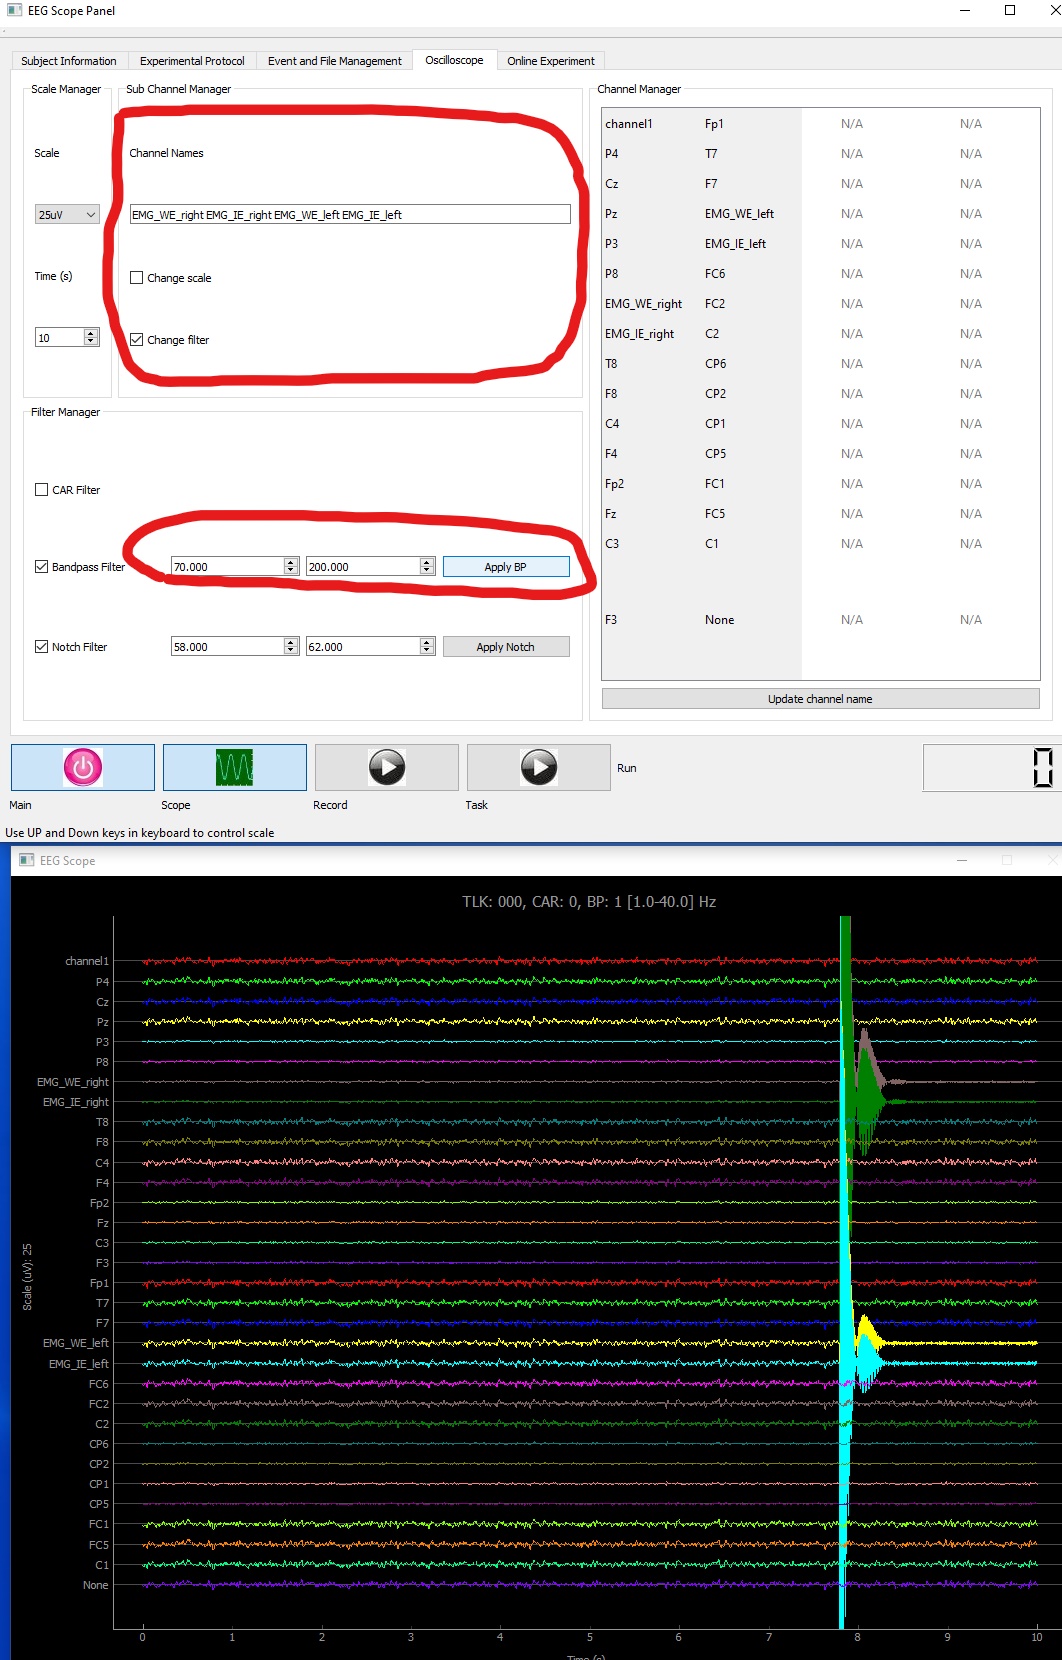
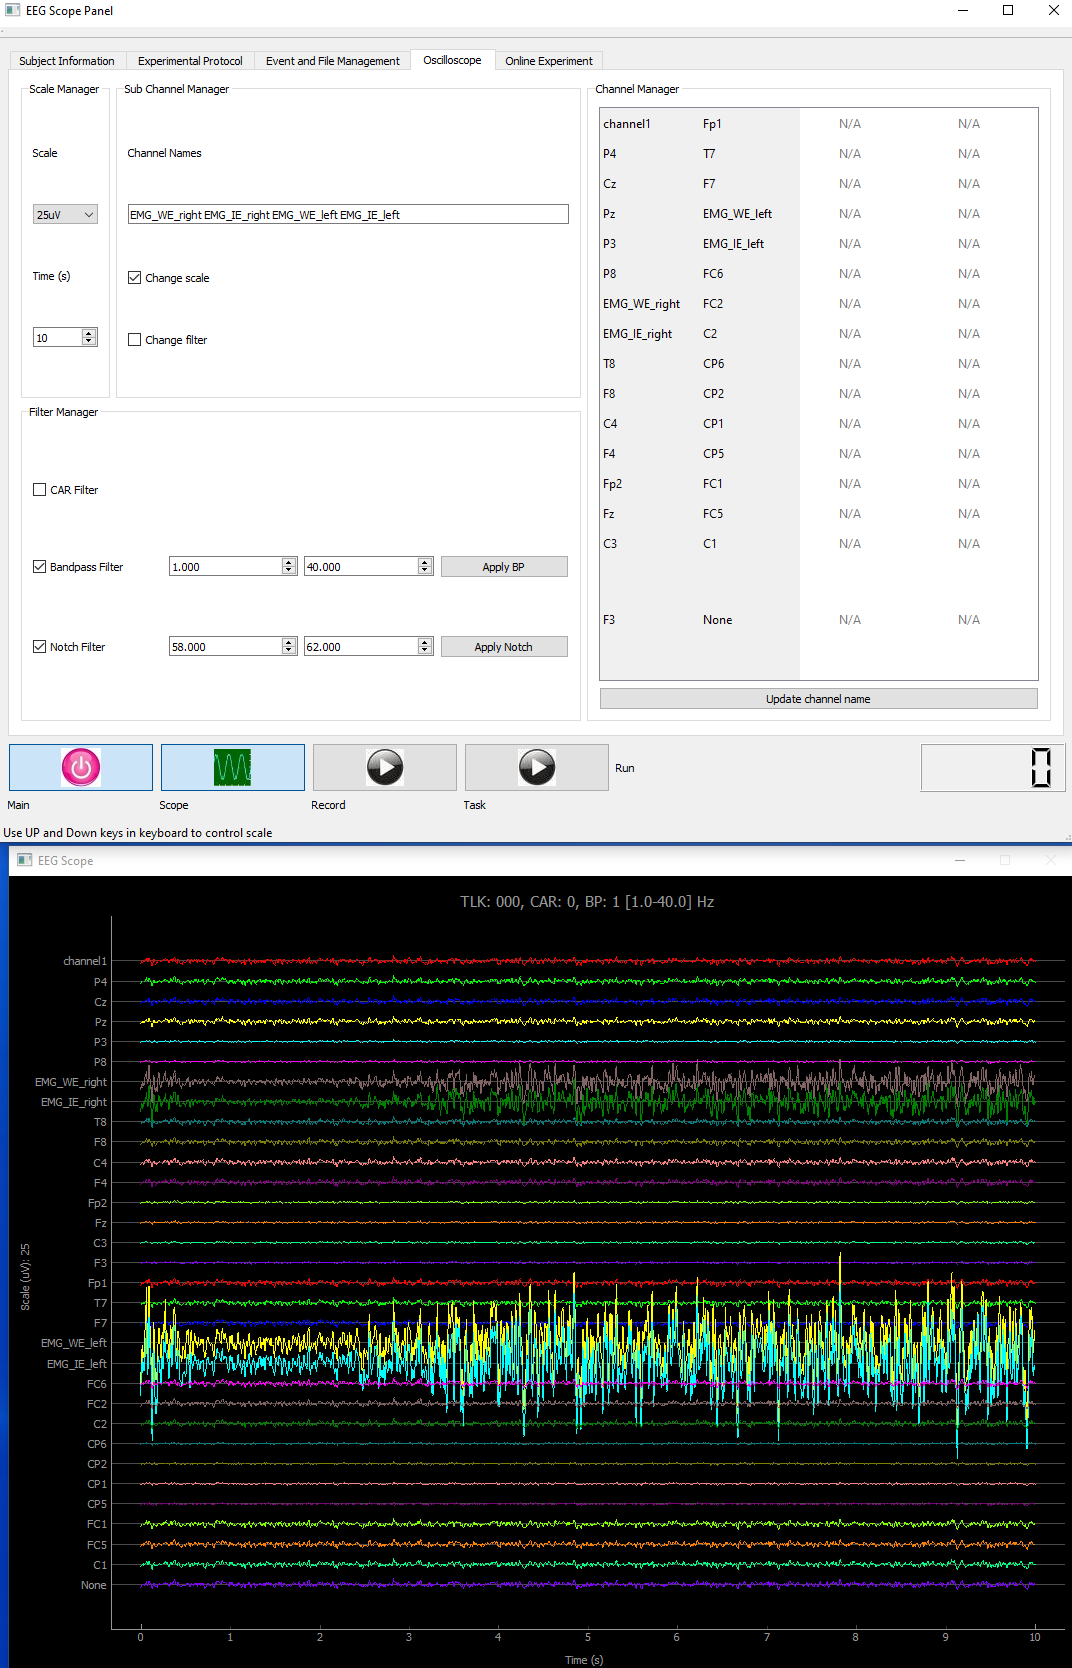
Some times we have different signals which require unique filter or scales for better visualization. For example, EMG data will be used in most movement related experiments, a different set of cut-off frequencies could be defined.
Change filter. Type in selected channel names in sub channel manager, separate each channel name by a space. Check Change filter and type in new cut-off frequencies in filter manager.
Change scale. Type in selected channel names in sub channel manager, check change scale and use up/down arrow key in your keyboard to scale up/down respectively.
